Physical Inactivity Attributable Hospital Admissions
Physical activity is important for physical and mental health and physical inactivity has been identified as a risk factor for a range of diseases such as cardiovascular disease, stroke and certain cancers. Inequalities in physical activity participation are well documented with a difference of more than 10 percentage points in the probability of being physically active between the most and the least deprived quartile of areas in England. We created a new dataset of physical inactivity attributable hospitalisations at small area level in order to investigate whether this inequality was also reflected in hospitalisation data and to provide a resource for local policy makers.
While we might have information on which disease was the main reason for a hospitalisation it is usually not possible to tell whether the individual developed the disease because they were physically inactive or for another reason. However, if we know the relative risk of the disease for being physically inactive compared with being active along with the prevalence of physical inactivity in the population, then we can estimate the proportion of all cases of a particular disease in the population that would not have occurred if the individuals had been physically active. This is known as the population attributable fraction.
We can then use this to estimate the number of hospitalisations attributable to physical inactivity. For example, let’s say that the population attributable fraction for physical activity for hospitalisation by disease x is 0.2 and the population attributable fraction for disease y is 0.1. In this case, if there were 2 hospitalisations for disease x in an area in a given year and 6 hospitalisations for disease y we would say that there was 1 (2*0.2 + 6*0.1) physical activity attributable hospitalisation in that area in that year. In our study, we used published population attributable fractions for physical activity for a range of diseases from the Global Burden of Disease study. These allowed us to estimate yearly Physical Inactivity Attributable Hospitalisations at the small area (Middle-layer Super Output Area, MSOA) level across England using Hospital Episode Statistics data from 2005 to 2019.
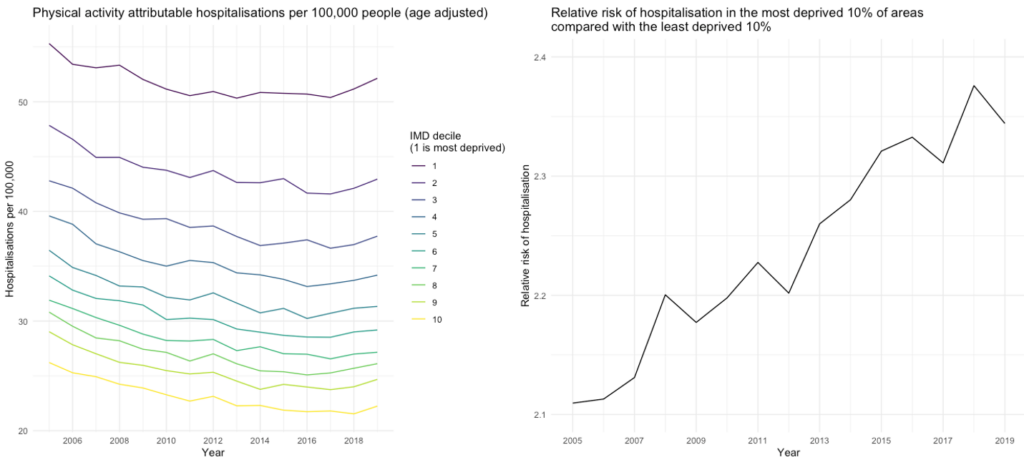
The good news is that (age adjusted) physical activity hospitalisations have declined over the last decade and a half, although most of this decline happened between 2005 and 2010 and there is some evidence of a small rise after 2017 (Figure 1). The bad news is that as we might expect there are sizeable inequalities across the country. For example, in 2019 there were 30 additional hospital admissions per 100,000 people attributable to physical inactivity in the most deprived decile of areas than in the least deprived decile. Furthermore, this inequality has been worsening over time at least in relative terms, with the rate of physical inactivity attributable hospital admissions rising from 2.1 times higher in the most deprived decile of areas, compared with the least deprived decile, in 2005 to 2.4 times higher in 2019. Of particular concern should be the large gap between the bottom decile and all the others along with the pronounced uptick in rate of hospitalisations in the last few years in this most deprived 10%.
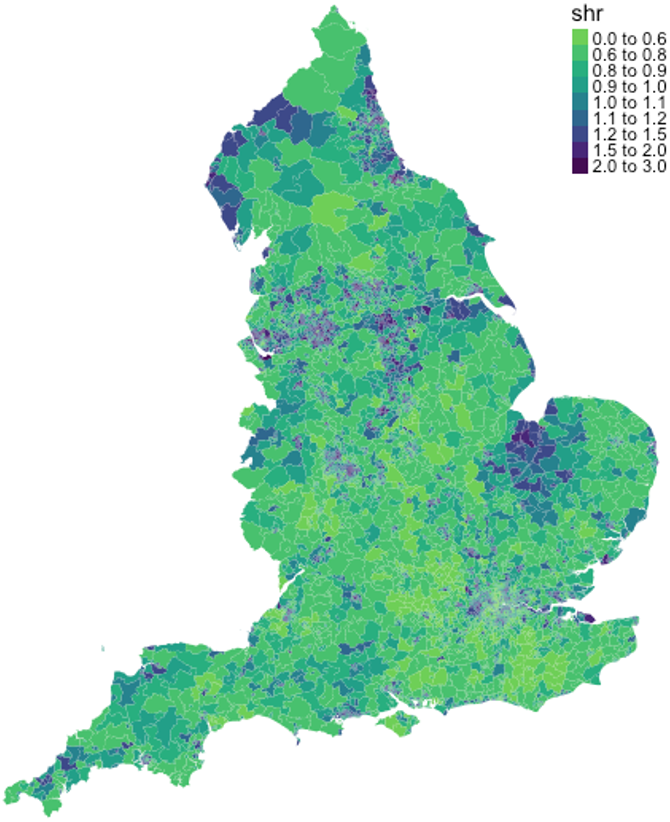
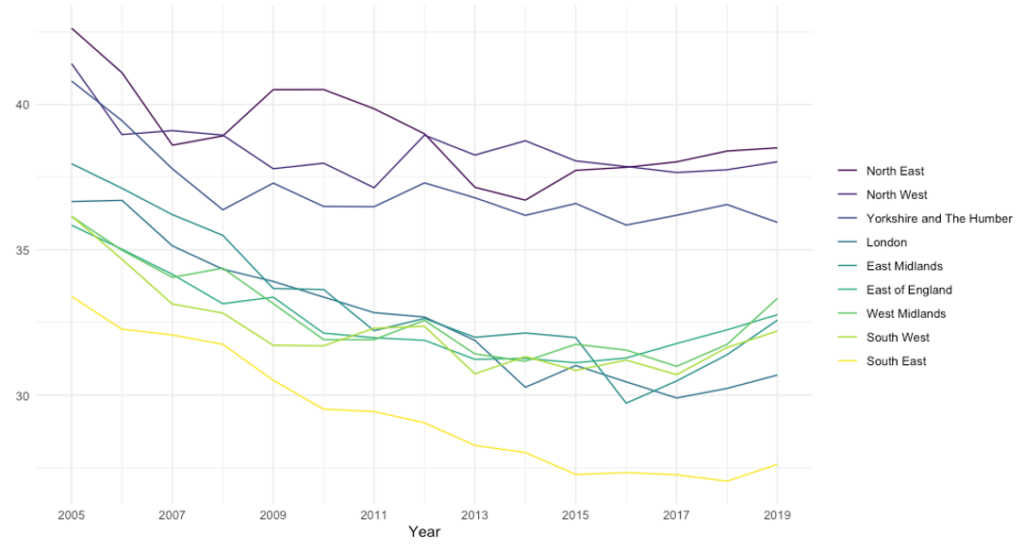
When we map the data, shown here for 2018 (Figure 2), we can see that urban and post-industrial areas in the North of England are the worst effected, but there are also high levels in other areas such as the east of England in parts of Lincolnshire and Norfolk. If we split the data at the regional level we can see three groups of regions with distinct trajectories (Figure 3). The North of England (North West, North East and Yorkshire and the Humber) has consistently had the highest levels of hospitalisations and the observed decline in hospitalisations lasted only until 2010 before flatlining over the last decade. The Midlands, East, South West and London have lower levels of hospitalisations and saw a longer period of decline continuing until around 2015, but then saw the sharpest rises in the post 2017 period. Finally, the South East has had consistently the lowest levels of hospitalisations.
Given what we know about inequalities in physical activity levels it is perhaps unsurprising to see these inequalities present in the hospitalisation data. Nevertheless, they provide further evidence for the urgent need to improve physical activity levels in the most deprived communities, particularly in the context of widening inequalities in physical activity brought about by restrictions associated with the Covid-19 pandemic.
Data Source: https://pldr.org/dataset/v83p1/